Kpler’s Alex Booth looks at how the global crude crisis in 2020 came about, how it affected storage and the direction of the trends now.
THE BUILD-UP TO THE GLOBAL CRUDE OVERHANG – A PRICE WAR COMPOUNDED BY COVID-19
The build-up to the global crude crisis started long before COVID-19 decimated demand. OPEC+ had been cutting output since 2016 to try and limit the slide in oil prices brought about from the rise of US shale oil production. As US production continued to grow and the coalition continued to lose market share, tensions frayed as to the best approach to combat the threat. The breakdown in relations between Saudi Arabia and Russia came to a head in spring of this year as their production cut agreement came to an end just as the impact of the pandemic was hitting full swing. With the taps opening from 1 April 2020, the scene was set for the perfect storm of overproduction at the same time as the most severe demand curtailments ever witnessed.
NET LENGTH BUILDING IN THE CRUDE MARKETS
In the six months leading up to April 2020, global waterborne crude exports averaged 42.5 million bpd, off the highs of 2018 but a significant increase on the 39.1 million bpd of September 2019, the month of the attack on the Abqaiq crude processing facility in Saudi Arabia. In April, waterborne exports jumped to 45.8 million bpd, an increase of 3.6 million bpd on the prior month. It is hard to comprehend the scale of this increase, especially when 2.2 million bpd came from one country alone – Saudi Arabia. The swing in exports between April and May was even more extraordinary in scale. Exports averaged 38.9 million bpd in May, a drop of 7 million bpd. Once again, having led to the length in April, Saudi Arabia was the single biggest contributor to this cut, down 3.2 million bpd m/m. Russia also saw a significant reduction in waterborne exports, down 0.9 million bpd on the month. Global crude exports finally bottomed out in June at 35.4 million bpd compared to an average of 41.8 million bpd through 2019.
Global waterborne imports followed their typical seasonal pattern through the winter of 2019/2020, although overall flows were down y/y. While exports hit a record high, April imports fell by 1.5 million bpd m/m and 2.7 million bpd y/y to 39.8 million bpd. After a slight rebound in May, as long-haul barrels were absorbed, imports continued to decline before hitting a bottom in July at 36.9 million bpd. The last time that a level this low was seen in Kpler’s data was back in September 2014.
With record exports and declining imports, net flows hit an all-time high of 6.1 million bpd or 182 million bbl of surplus waterborne crude in April. It is only through four months of restricted crude production and an onshoring (but not consumption) of oil that has led to this overhang being cleared with 188 million bbl taken off the water by the end of August.
THE TRANSITION BETWEEN ONSHORE AND OFFSHORE BUILD PHASES
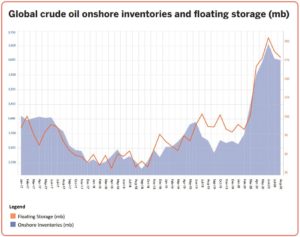
As highlighted above, it is not correct to say that surplus oil has been cleared and the crisis over. The oil that weighed so heavily on the markets has now moved onshore. The ebb and flow of crude between vessels in transit, vessels acting as floating storage and onshore tankage has been a constant factor over the last five months. A metric commonly used to analyse the state of the crude market is oil-on-water (OOW), a measure of how much oil is held on vessels, either in transit or floating. Given that ships slow steaming can act as a form of storage or vessels will move to a location before ‘officially’ becoming floating storage, OOW can give a more immediate signal of burgeoning length or a tightening in the waterborne market. When used in conjunction with the better-known metric of floating storage and onshore inventories data you can get a much more complete picture of the market dynamic.
Oil-on-water pointed to an oversupplied market even before COVID-19 spread out globally. We typically see builds through December before draws in January and February. This year, we experienced the seasonal build through December 2019 and slight draw in January 2020, before volumes started to rise again in February. As such, OOW was already at high levels before the weight of the overhang came to bear in April.
Onshore storage had also started to build at accelerated rates by March 2020, before the deluge of additional oil from Saudi Arabia and Russia in April. Global onshore inventories added 100 million bbl or 3.2 million bpd through March with builds seen in every region around the world, although China saw the biggest builds of 45 million bbl.
In April 2020, a further 103 million bbl or 3.4 million bpd was added to onshore inventories whilst a staggering 145 million bbl, the equivalent of nearly 73 very large crude carriers (VLCCs), was added to OOW. Floating storage volumes made up 67 million bbl of this. All of these onshore and offshore measures represented the fastest rate of builds tracked in Kpler’s dataset. The drastic cut in exports in May had an immediate impact on the rate of build into the summer, with floating storage and onshore inventories increasing at an average of 0.63 million bpd and 1.74 million bpd respectively.
GLOBAL INVENTORY LEVELS PEAK IN JUNE WITH THE US AND CHINA LEADING THE WAY
Onshore inventory levels as tracked by Kpler peaked on the 30 June 2020 at 3.657 million bbl. A build of 346 million bbl from the year low on the 8 February 2020. The absolute build will certainly have been greater as tracking coverage is limited to floating roof tanks and certain specific fixed roof and cavern locations. The increase in use of fixed roof tanks in the US Gulf Coast means that according to EIA data there was an additional 50 million bbl stored by the peak in June in the US, compared to global tracking data. Global stocks have since declined, particularly in the later part of August, and now rest at 3.606 million bbl.
The biggest onshore builds were seen in China and the US. These two countries had by far the biggest available capacity around the world, as well as either an appetite to buy crude at an exceptionally low spot price to add to strategic stocks or commercial players able to take advantage of the contango price structure to make a return on storing crude.
Chinese imports of crude oil have reached unprecedented levels in recent months. Through 2019, crude oil imports according to Kpler’s tracking averaged 9.283 million bpd. Imports in the four months of May to August 2020 averaged 11.343 million bpd with June 2020 topping out at 11.95 million bpd. Whilst China is about the only country in the world to show a significant, sustained recovery in crude demand, a significant proportion of these imports have ended up in storage. According to Kpler’s data, China started the year with crude inventories of 751 million bbl. These now sit at 883 million bbl, an increase of 132 million bbl, of which 466 million bbl is in commercial facilities.
According to data from the EIA, crude inventories in the US added a similar volume, rising from 1.065 million bbl at the start of the year to a peak of 1.195 million bbl by the end of June. Since this point, there has been a marked drawdown however, as sustained production cuts have countered lower refinery demand and the country has returned to a net exporter of crude. This return to net exports is worth highlighting – by the end of 2019, the US was a consistent net exporter, right through to April. This changed in May and June with the significant and well publicised imports of Saudi Arabian oil. Imports across the two months averaged 1.234 million bpd, compared to an average of 465,000 bpd through 2019. Whilst many of these barrels ended up at Motiva, there were many other players who had taken advantage of beneficial Saudi OSPs in the months prior to ship oil to the US.
REGIONAL DIFFERENCES IN STORAGE CHANGES: EAST ASIA AND EUROPE BUILDS, INDIA FAILS TO CAPITALISE ON LOW PRICES
Whilst the US and China had the biggest scope to build onshore inventories, builds were seen in all regions. Asia ex-China added 70 million bbl between February and June 2020, hitting 609 million bbl as recorded by Kpler. July saw a slight drawdown in stocks, driven by Japan and South Korea, although the region is now almost back up to the highs. A similar situation is seen in OECD Europe where stocks capped out in June, hitting 314 million bbl before dropping slightly to 306 million bbl by the end of August.
Despite aims to increase Strategic Petroleum Reserves (SPR) in India, the limited spare capacity has meant that the country has been unable to capitalise on weak crude prices in the same way as China. Whilst they have essentially filled the available SPR capacity, this was only an increase of 15.4 million bbl. Inventories held at commercial refineries built initially but with limited spare capacity.

SPARE CAPACITY AND THE PROBLEMS FACED FILLING IT
Outside of the US where inventory levels are falling the fastest, many areas of the world, in particular China, have the problem of how to fill the last remaining capacity. China is still trying to absorb crude bought at the lows of the oil price crisis of April, especially long-haul barrels from the US. Congestion in Chinese ports for discharging crude had been averaging 15 days compared to a normal baseline of four days. Because of these factors, over half of all global crude floating storage (97.5 million bbl out of 186.5 million bbl) is held in Chinese waters waiting to onshore.
When you look at the breakdown of available storage capacity in China, it becomes apparent as to why this is the case. Outside of government controlled SPR facilities, there is approximately 142 million bbl of working commercial capacity left in China. As a general metric, this assumes 90% of shell capacity is useable. Of this, there are just five installations with remaining capacity between 10–21 million bbl. There are a further 26 locations with some degree of spare capacity, the majority of which are between 0.2–5 million bbl. The highly distributed nature of this remaining capacity means that filling it efficiently or potentially at all will be highly challenging, as evidenced by the backlog of crude waiting to discharge.
At present, the state of the global demand recovery remains uncertain at the same time that many of the world’s major crude producers are looking to increase supply. It is by no means clear that this oil is required and whilst the pressure has been somewhat taken off the global onshore storage system, it is still not best placed to absorb that many unwanted barrels
For more information: This article was written by Alex Booth, head of market analysis at Kpler.
To find more interviews like this visit www.tankstoragemag.com
")